ตำรามาตรฐานยาสมุนไพรไทย
Thai Herbal Pharmacopoeia
สำนักยาและวัตถุเสพติด กรมวิทยาศาสตร์การแพทย์ กระทรวงสาธารณสุข
Bureau of Drug and Narcotic, Department of Medical Sciences, Ministry of Public Healthสำนักยาและวัตถุเสพติด กรมวิทยาศาสตร์การแพทย์ กระทรวงสาธารณสุข
Bureau of Drug and Narcotic, Department of Medical Sciences, Ministry of Public Health(Tinospora crispa (L.) Hook.f. & Thomson)
(Nelumbo nucifera Gaertn.)
(Centella asiatica (L.) Urb.)
(Centella Dry Extract)
(Centella Cream)
(Mesua ferrea L.)
(Piper sarmentosum Roxb.)
(Piper sarmentosum Roxb.)
(Pterocarpus santalinus L. f.)
(Santalum album L.)
(Senna tora (L.) Roxb.)
(Senna alata (L.) Roxb.)
(Senna Alata Tea)
(Piper retrofractum Vahl)
(Myristica fragrans Houtt)
(Andrographis paniculata (Burm. f.) Nees)
(Andrographis Capsules)
(Allium ascalonicum L.)
(Ocimum tenuiflorum L.)
(Curcuma longa L.)
(Turmeric Capsules)
(Turmeric Dry Extract)
(Turmeric Dry Extract Capsules)
(Arcangelisia flava (L.) Merr.)
(Curcuma sp.)
Harrisonia perforata (Blanco) Merr.
(Aristolochia pierrei Lecomte)
(Zingiber officinale Roscoe)
(Ginger Capsules)
(Ginger Tea)
(Cassia fistula L.)
(Nardostachys jatamansi (D. Don) DC.)
(Angelica sinensis (Oliv.) Diels)
Artemisia annua L.
(Ligusticum sinense Oliv. cv. Chuanxiong)
(Neopicrorhiza scrophulariiflora Pennell)
(Atractylodes lancea (Thunb.) DC.)
(Aucklandia lappa Decne)
(Terminalia chebula Retz.)
(Angelica dahurica (Hoffm.) Benth. & Hook. f. ex Franch. & Sav. var. dahurica)
(Kaempferia parviflora Wall. ex Baker)
(Hibiscus sabdariffa L.)
(Roselle Tea)
(Allium sativum L.)
(Zingiber zerumbet (L.) Sm.)
(Wurfbainia testacea (Ridl.) Škorničk.& A. D. Poulsen)
(Cannabis sativa L.)
(Myristica fragrans Houtt)
(Dracaena cochinchinensis (Lour.) S. C. Chen)
(Ficus racemosa L.)
(Hyptis suaveolens (L.) Poit.)
Clerodendrum indicum (L.) Kuntze
(Phyllanthus emblica L.)
(Citrus hystrix DC.)
(Citrus hystrix DC.)
(Areca catechu L.)
(Momordica charantia L.)
Moringa oleifera Lam.
(Aegle marmelos (L.) Corrêa)
(Solanum trilobatum L.)
(Morus alba L.)
Gynostemma pentaphyllum(Thunb.)
Makino
(Clinacanthus nutans (Burm. f.) Lindau)
(Cissus quadrangularis L.)
(Mimusops elengi L.)
(Zingiber montanum (J. König) Link. ex A. Dietr.)
(Piper betle L.)
(Capsicum annuum L.)
(Capsicum Oleoresin)
(Capsicum Gel)
(Piper nigrum L.)
(Piper nigrum L.)
(Eurycoma longifolia Jack)
(Thunbergia laurifolia Lindl.)
(Piper wallichii (Miq.) Hand.-Mazz.)
Senna garrettiana (Craib) H. S. Irwin & Barneby
(Terminalia bellirica (Gaertn.) Roxb.)
(Terminalia chebula Retz.)
(Caesalpinia bonduc (L.) H. Roxb.)
(Tarlmounia elliptica (DC.) H. Rob., S. C. Keeley, Skvaria & R. Chan)
(Hog Creeper Vine Dry Extract Capsiles)
(Hog Creeper Vine Dry Extract)
(Brachypterum scandens (Roxb.) Miq.)
(Lepidium sativum L.)
(Nigella sativa L.)
(Cuminum cyminum L.)
(Foeniculum vulgare Mill.)
(Plantago ovata Forssk.)
(Pimpinella anisum L.)
(Carum carvi L.)
(Anethum graveolens L.)
(Trachyspermum ammi (L.) Sprague)
Albizia procera (Roxb.) Benth.
(Acorus calamus L.)
(Tiliacora triandra (Colebr.) Diels)
Cyanthillium cinereum (L.) H. Rob.
(Orthosiphon aristatus (Blume) Miq.)
Murdannia loriformis (Hassk.) R. S. Rao & Kammathy
(Capparis micracantha DC.)
(Chrysopogon zizanioides (L.) Roberty)
(Cyperus rotundus L.)
(Cannabis sativa L.)
(Syzygium aromaticum (L.) Merr. & L. M. Perry)
(Boesenbergia rotunda (L.) Mansf.)
(Acanthus ebracteatus Vahl)
(Acanthus ilicifolius L.)
(Kaempferia galanga L.)
(Curcuma comosa Roxb.)
Betula alnoides Buch.-Ham. ex D. Don
Cannabis sativa L.
Carthamus tinctorius L
Mitragyna speciosa (Korth.) Havil
Mallotus repandus (Rottler) Müll. Arg
Azadirachta indica A. Juss. var. siamensis Valeton
Azadirachta indica A. Juss. var. siamensis Valeton
Punica granatum L.
Rhinacanthus nasutus (L.) Kurz
Baliospermum solanifolium (Burm.) Suresh
Curcuma aeruginosa Roxb
Boesenbergia kingii Mood & L. M. Prince
Senegalia rugata (Lam.) Britton & Rose
Acacia concinna (Willd.) DC.
Senegalia rugata (Lam.) Britton & Rose
Acacia concinna (Willd.) DC.
Senna alexandriana Mill. var. alexandriana
Cassia acutifolia Delile, Cassia angustifolia Vahl
Butea superba Roxb. ex Willd.
[Plaso superba (Roxb. ex Willd.) Kuntze, Rudolphia superba (Roxb. ex Willd.) Poir.
Pueraria candollei Graham
ex Benth. var. mirifica (Airy Shaw & Suvat.) Niyomdham
Streblus asper Lour.
Suregada multiflora (A. Juss.) Baill. (Gelonium
multiflorum A. Juss.
Plumbago zeylanica L.
Plumbago indica L.
Biancaea sappan (L.) Tod.
Ziziphus attopensis Pierre
Streblus asper Lour.
Justicia gendarussa Burm. f.
Enhalus acoroides (L. f.) Royle
Bridelia ovata Decne.
Tamarindus indica L.
Citrus × aurantiifolia (Christm.) Swingle
Garcinia mangostana L.
Blumea balsamifera (L.) DC
Persicaria odorata (Lour.) Soják
Zingiber montanum (J. König) Link ex A. Dietr.
Mammea siamensis (Miq.) T. Anderson
Citrus maxima (Burm.) Merr.
Citrus × aurantium L. ‘Som Sa'
Punica granatum L.
Rhinacanthus nasutus (L.) Kurz
3.9 CHROMATOGRAPHIC SEPARATION TECHNIQUES
Interpretation of Chromatograms
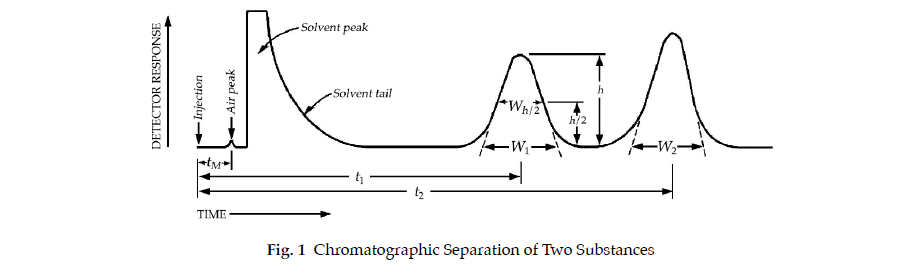
Figure 1 represents a typical chromatographic separation of two substances, 1 and 2, where t1 and t2 are the respective retention times. h, h/2, and Wh/2 are the height, the halfheight, and the width at half-height, respectively, for peak 1. W1 and W2 are the respective widths of peaks 1 and 2 at the baseline. Air peaks are a feature of gas chromatograms and correspond to the solvent front in liquid chromatography.
Chromatographic retention times are characteristic of the compounds they represent but are not unique. Coincidence of retention times of a test and a reference substance can be used as a feature in construction of an identity profile but is insufficient on its own to establish identity. Absolute retention times of a given compound vary from one chromatogram to the next.
The elution time of a compound can be described by the retention factor, k, which depends on the composition and surface area of the stationary phase phase, and the composition and surface area of the stationary phase.
The retention factor (also known as the capacity factor, k’) is defined as :

where t is the retention time measured from time of injection to time of elution of peak maximum and tM is the hold-up time–the time required for elution of a non-retained component, shown in Figure 1 as an air or non-retained solvent peak, with the baseline scale in minutes.
The volume of mobile phase required for elution of a component is defined as retention volume, V, It may be calculated from the retention time and the flow rate, F, in mL/min:
V = t × F
The volume of mobile phase required for elution of a non-retained component is defined as the hold-up volume, VM. It may be calculated from the hold-up time, tM , and the flow rate, F, in mL/min:
VM = tM × F
Comparisons are normally made in terms of relative retention times, Rr, unless otherwise specified in the monograph:

where t2 and t1 are the retention times, measured from the point of injection, of the test and reference substances, respectively, determined under identical experimental conditions on the same column.
Other procedures may identify the peak position using the relative retention, r:
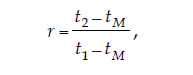
where tM is the retention time of a non-retained component, which needs to be defined in the procedure.
The number of theoretical plates, N, is a measure of column efficiency. For Gaussian peaks, it is calculated by the equation:

where t is the retention time of the substance and W is the width of the peak at its base, obtained by extrapolating the relatively straight sides of the peak to the baseline. The value of N depends on the substance being chromatographed as well as the operating conditions such as mobile phase or carrier gas flow rates and temperature, the quality of the packing, the uniformity of the packing within the column and, for capillary columns, the thickness of the stationary phase film, and the internal diameter and length of the column
The separation of two components in a mixture, the resolution, R, is determined by the equation:
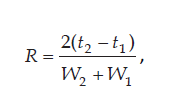
where t2 and t1 are the retention times of the two components, and W2 and W1 are the corresponding widths at the bases of the peaks obtained by extrapolating the relatively straight sides of the peaks to the baseline.
Where electronic integrators are used, it may be convenient to determine the number of theoretical plates, N, by the equation:
N = 5.54(t/W2,h/2 )2 ,
and to determine the resolution, R, by the equation:
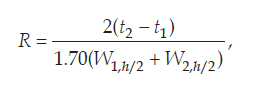
where Wh/2 is the peak width at half-height, obtained directly by electronic integrators. However, in the event of dispute, only equations based on peak width at baseline are to be used.
Peak areas and peak heights are usually proportional to the quantity of compound eluting. Peak areas are generally used but may be less accurate if peak interference occurs. For accurate quantitative work, the components to be measured should be separated from any interfering components. Peak tailing and fronting and the measurement of peaks on solvent tails are to be avoided.
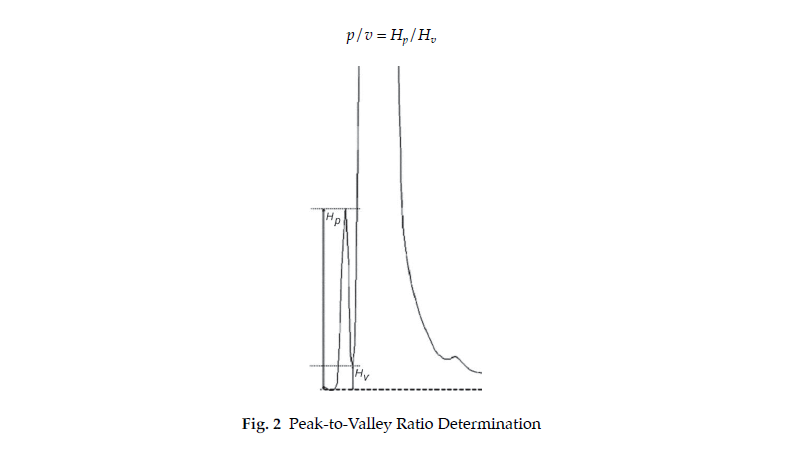
The peak-to-valley ratio, p/v, may be employed as a system suitability criterion in a test for related substances when baseline separation between two peaks is not achieved. Figure 2 represents a partial separation of two substances, where Hp is the height above the extrapolated baseline of the minor peak and Hv is the height above the extrapolated baseline at the lowest point of the curve separating the minor and major peaks:
Chromatographic purity tests for drug raw materials are sometimes based on the determination of peaks due to impurities, expressed as a percentage of the area due to the drug peak. It is preferable, however, to compare impurity peaks to the chromatogram of a standard at a similar concentration. The standard may be the drug itself at a level corresponding to, for example, 0.5 per cent impurity, or in the case of toxic or signal impurities, a standard of the impurity itself.
System Suitability
System suitability tests are an integral part of gas and liquid chromatographic methods. They are used to verify that the detection sensitivity, resolution, and reproducibility of the chromatographic system are adequate for the analysis to be done. The tests are based on the concept that the equipment, electronics, analytical operations, and samples to be analyzed constitute an integral system that can be evaluated as such.
Factors that may affect the chromatographic behavior include
— the composition, ionic strength, temperature, and apparent pH of the mobile phase;
— Flow rate, column dimensions, column temperature, and pressure;
— stationary phase characteristics including type of chromatographic support (particle-based or monolithic ), particle or macropore size, porosity, and specific surface area;
— reversed phase and other surface modification of the stationary phases, the extent of chemical modification (as expressed by end-capping , carbon loading, etc.).
The detection sensitivity is a measure used to ensure the suitability of a given chromatographic procedure for the complete detection of the impurities in the Chromatographic purity or Related compounds tests by injecting a volume of a quantitation limit solution equal to that of the Test solution. Unless otherwise specified in the individual monograph, the quantitation limit solution may be prepared by dissolving the Drug Reference Substance in the same solvent as that used for the Test solution at a 0.05 per cent concentration level relative to the amount of drug substance in the Test solution for drug substances, and a 0.1 per cent level relative to the amount of drug substance in the Test solution for drug products. The signal-to-noise ratio for the drug substance peak obtained with the quantitation limit solution should be not less than 10.
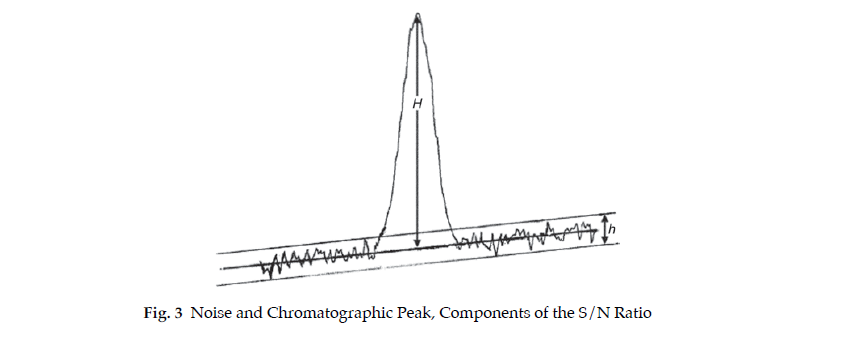
The signal-to-noise (S/N) ratio is determined by the equation:
S/N ratio = 2H/h
where H is the height of the peak measured from the peak apex to a baseline extrapolated over a distance ≥ 5 time the peak width at its half-height, and h is the difference between the largest and largest and smallest noise values observed over a distance ≥ 5 time the width at the half-height of the peak and, if possible, situated equally around the peak of interest (Fig. 3).
The resolution, R, is a function of the number of theoretical plates, N (also referred to as column efficiency) and may be specified to ensure that closely eluting compounds are resolved from each other, to establish the general resolving power of the system, and to ensure that internal standards are resolved from the drug. Column efficiency may be specified also as a system suitability requirement, especially if there is only one peak interest in the chromatogram; however, it is a less reliable means to ensure resolution than direct measurement. Column efficiency is a measure of peak sharpness, which is important for the detection of trace components.
Replicate injections of a standard preparation used in the assay or other standard solution are compared to ascertain whether requirements for precision are met. Unless otherwise specified in the individual monograph, data from five replicate injections of the analyte are used to calculate the relative standard deviation, RSD, if the requirement is 2.0 per cent or less; data from six replicate injections are used if the relative standard deviation requirement is more than 2.0 per cent.
RSD (%) relative standard deviation in percentage,
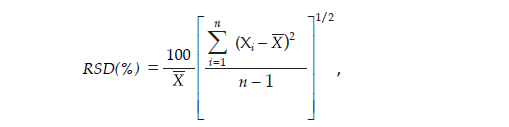
where Xi is an individual measurement in a set of n measurements and x̄ is the arithmetic mean of the set.
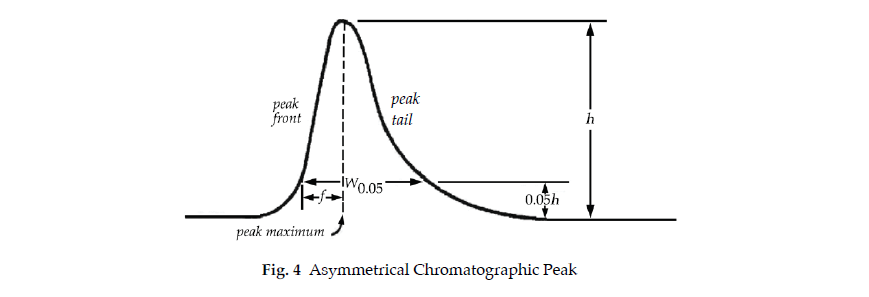
The symmetry factor (or tailing factor), T, a measure of peak symmetry, is unity for perfectly symmetrical peaks and its value increases as tailing becomes more pronounced (Fig. 4):
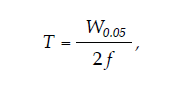
where T is the symmetry factor (or tailing factor), W0.05 is the width of the peak at 5 per cent height and f is the distance from the peak maximum to the leading edge of the peak, the distance being measured at a point 5 per cent of the peak height from the baseline. In some cases, values less than unity may be observed. As peak asymmetry increases, integration and hence precision become less reliable.
These system suitability tests are performed by collecting data from replicate injections of standard or other solutions as specified in the individual monograph. The specification of definitve parameters in a monograph does not preclude the use of other suitable operating conditions. Adjustments of operating conditions to meet system suitability requirements may be necessary
Unless otherwise directed in the monograph, system suitability parameters are determined from the analyte peak.
Relative retention times may be provided in monographs for informational purposes only, to aid in peak identification. There are no acceptance criteria applied to relative retention times.
To ascertain the effectiveness of the final operating system, it should be subjected to suitability testing. Replicate injections of the standard solution required to demonstrate adequate system precision may be made before the injection of samples or may be interspersed among sample injections. System suitability must be demonstrated throughout the run by injection of an appropriate control preparation at appropriate intervals. The control preparation can be a standard preparation or a solution containing a known amount of analyte and any additional materials useful in the control of the analytical system. Such as excipients or impurities. Whenever there is a significant change in equipment or in a critical reagent, suitability testing should be performed before the injection of samples. No sample analysis is acceptable unless the requirements of system suitability have been met. Sample analyses obtained while the system fails system suitability requirements are unacceptable.
Adjustment of Chromatographic Conditions
The extent to which the various parameters of a chromatographic test may be adjusted to satisfy the system suitability criteria without fundamentally modifying the methods are listed below. Adjustment of conditions with gradient elutions is more critical than with isocratic elutions, since it may lead to shifts in peaks to a different step of the gradient, thus leading to the incorrect assignment of peaks, and to the masking of peaks or a shift such that elution occurs beyond the prescribed elution time. Changes other than those indicated require revalidate of the method. The chromatographic conditions described have been validated during the elaboration of the monograph.
The system suitability tests are included to verify that the separation required for satisfactory performance of the test or assay is achieved. Nonetheless, since the stationary phases are described in a general way and there is such a variety available commercially, with differences in chromatographic behavior, some adjustments of the chromatographic conditions may be necessary to achieve the prescribed system suitability requirements. With reversed-phase liquid chromatographic methods, in particular, adjustment of the various parameters will not always result in satisfactory chromatography. In that case, it may be necessary to replace the column with another of the same type (e.g., octadecylsilyl silica gel) which exhibits the desired chromatographic behaviour.
For critical parameters the adjustments are defined clearly in the monograph to ensure the system suitability.
Thin-Layer Chromatography and Paper Chromatography
COMPOSITION OF THE MOBILE PHASE; pH OF THE AQUEOUS COMPONENT OF THE MOBILE PHASE;
CONCENTRATION OF SALTS The adjustments can be made as described under Liquid Chromatography (Appendix 3.5).
APPLICATION VOLUME The application volume can be adjusted to 10 to 20 per cent of the (prescribed volume if using fine particle size plates (2 to 10 µm).
MIGRATION DISTANCE The migration distance of the solvent front is to be not less than 50 mm or 30 mm on high-performance plates.
Liquid Chromatography
COMPOSITION OF THE MOBILE PHASE The following adjustment limits apply to minor components of the mobile phase (specified at 50 per cent or less). The amount(s) of these component(s) can be adjusted by ±30 per cent relative. However, the change in any component cannot exceed ±10 per cent absolute (i.e., in relation to the total mobile phase), nor can the final concentration of any component be reduced to zero. Adjustment can be made to one minor component in a ternary mixture. Examples of adjustments are given below.
Specified ratio of 50:50 Thirty per cent of 50 is 15 per cent absolute, but this exceeds the maximum permitted change of ±10 per cent absolute in either component. Therefore, the mobile phase ratio may be adjusted only within the range of 40:60 to 60:40.
Specified ratio of 2:98 Thirty per cent of 2 is 0.6 per cent absolute. Therefore, the maximum allowed adjustment is within the range of 1.4:98.6 to 2.6:97.4.
Specified ratio of 60:35:5 For the second component, 30 per cent of 35 is 10.5 per cent absolute, which exceeds the maximum permitted change of ±10 per cent absolute in any component. Therefore, the second component may be adjusted only within the range of 25 per cent to 45 per cent absolute. For the third component, 30 per cent of 5 is 1.5 per cent absolute. In all cases, a sufficient quantity of the first component is used to give a total of 100 per cent. Therefore, mixture ranges of 50:45:5 to 70:25:5 or 58.5: 35:6.5 to 61.5:35:3.5 would meet the requirement.
pH OF THE AQUEOUS COMPONENT OF THE MOBILE PHASE The pH of the aqueous buffer user in the preparation of the mobile phase can be adjusted to within ±0.2pH of the value or range specified, or ±1.0 pH when neutral substances are to be examined
CONCENTRATION OF SALTS The concentration of the salts used in the preparation of the aqueous buffer used in the mobile phase can be adjusted to within ±10 per cent, provided the permitted pH variation is met.
DETECTOR WAVELENGTH No adjustment permitted.
STATIONARY PHASE
For isocratic separations, changes in column length, column internal diameter and particle size are allowed as follows:
— column length: ±70 per cent,
— column internal diameter: ±25 per cent,
— particle size: maximal reduction of 50 per cent, no increase permitted.
For gradient separations, only changes in column length and column internal diameter, are allowed as follows:
— column length: ±70 per cent,
— column internal diameter: ±25 per cent,
— particle size: no adjustment permitted.
FLOW RATE
For isocratic separations,the flow rate can be adjusted by ±50 per cent. When column dimensions are changed, the flow rate is determined by the equation:
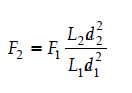
Where F1 is the flow rate specified in the monograph, in mL per minute; F2 is adjusted flow rate, in mL per minute; L1 is the length of the column specified in the monograph, in mm; L2 is the length of the column used, in mm is the length of the column used, in mm; d2 is the internal diameter of the column specified in the monograph, in mm; d2 is the internal diameter of the column used, in mm.
For gradient separations, the adjustment of the flow rate is allowed when changing the column dimensions. The flow rate is determined by the equation above.
COLUMN TEMPERATURE The column temperature can be adjusted as follows, unless Otherwise specified:
— isocratic separations: ±10°,
— gradient separations: ±5°.
INJECTION VOLUME The injection volume can be reduced as far as is consistent with accepted precision and detection limits. No increase in the injection volume is permitted.
Gas Chromatography
STATIONARY PHASE
— column length: ±70 per cent,
— column internal diameter: ±50 per cent,
— particle size: maximal reduction of 50 per cent, no increase permitted,
— Film thickness: -50 per cent to +100 per cent
FLOW RATE the flow rate can be adjusted by as much as +-50 per cent
OVEN TEMPERATURE The oven temperature can be adjusted by as much as ±10 per cent.
OVEN TEMPERATURE PROGRAM Adjustment of temperatures is permitted as stated above.
For the times specified for the temperature to be maintained or for the temperature to be changed from one value to another, an adjustment of up to ±20 per cent is permitted.
INJECTION VOLUME The injection volume can be reduced as far as is consistent with accepted precision and detection limits.
Quantification
Peaks due to solvents and reagents or arising from the mobile phase or the sample matrix are disregarded during quantification
DETECTOR SENSITIVITY The detector sensitivity is the signal output per unit concentration or unit mass of a substance in the mobile phase entering the detector. The relative detector response factor, commonly referred to as response factor, expresses the sensitivity of a detector for a given substance relative to a standard substance. The correction factor is the reciprocal of the response factor.
EXTERNAL STANDARD METHOD The concentration of the component(s) quantified is determined by comparing the response(s) obtained with the sample solution to the response(s) obtained with a standard solution.
INTERNAL STANDARD METHOD Equal amounts of the internal standard are introduced into the sample solution and a standard solution. The internal standard is chosen so that it does not react with the test material and does not contain impurities with the same retention time as that of the analyte, and is stable and resolved from the component(s) quantified (analytes). The concentrations of the analytes are determined by comparing the ratios of their peak areas or peak heights and the internal standard in the sample solution with the ratios of their peak areas or peak heights and the internal standard in the standard solution.
NORMALIZATION PROCEDURE The per cent content of a component of the test substance is calculated by determining the area of the corresponding peak as a percentage of the total area of all the peaks, excluding those due to solvents or reagents or arising from the mobile phase or the sample matrix and those at or below the limit at which they can be disregarded.
CALIBRATION PROCEDURE The relationship between the measured or evaluated signal y and the quantity (e.g., concentration or mass) of substance x is determined, and the calibration function is calculated. The analytical results are calculated from the measured signal or evaluated signal of the analyte and its position on the calibration curve.
In tests for impurities for both the external standard method, when a dilution of the sample solution is used for comparison, and the normalization procedure, any correction factors indicated in the monograph are applied (e.g., when the relative response factor is outside the range of 0.8 to 1.2).
When the impurity test prescribes the total of impurities or there is a quantitative determination of an impurity, choice of an appropriate threshold setting and appropriate conditions for the integration of the peak areas is important. In such tests the limit at or below which a peak is disregarded is generally 0.05 per cent. Thus, the threshold setting of the data collection system corresponds to at least half of this limit. Integrate the peak area of any impurity that is not completely separated from the principal peak, preferably by valley-to-valley extrapolation (tangential skim).